
Photos of the high king tides may provide answers about rising sea levels in Washington state.
Researchers will use these photos to gather research in the hopes of discovering more about the impact of global warming and severe storms on local shorelines.
To understand how king tides work, one needs to look at a much bigger picture.
“There are 400 cycles in the heavens [atmosphere] that influence the tides,” said Jonathan White, local author of “Tides: The Science and Spirit of the Ocean.” “It’s [the cycles] like a number of gears moving, and once in a while they all line up in an extraordinary way.”
According to Washington Sea Grant, king tides made for extreme high tides along the Washington coast from Nov. 26-28. The tides will rise again between 8 to 10 feet above normal, depending on the area, from about Dec. 25-Dec. 27 and Jan. 23 -Jan. 25,. To find the exact times for specific locations, visit tidesandcurrents.noaa.gov.
King tides are caused by the alignment of the Earth, sun and moon, also called syzygy, a Greek word meaning together, White explained. The moon could be full, new or anywhere in between, it is the position of those celestial bodies that results in an extra gravitational pull affecting the oceans. There are numerous variations of king tides, added White, some more extreme than others. For example, the moon does not have a perfectly circular orbit. When the moon orbits closer to the Earth and is lined up with the sun, king tides will be even more extreme.
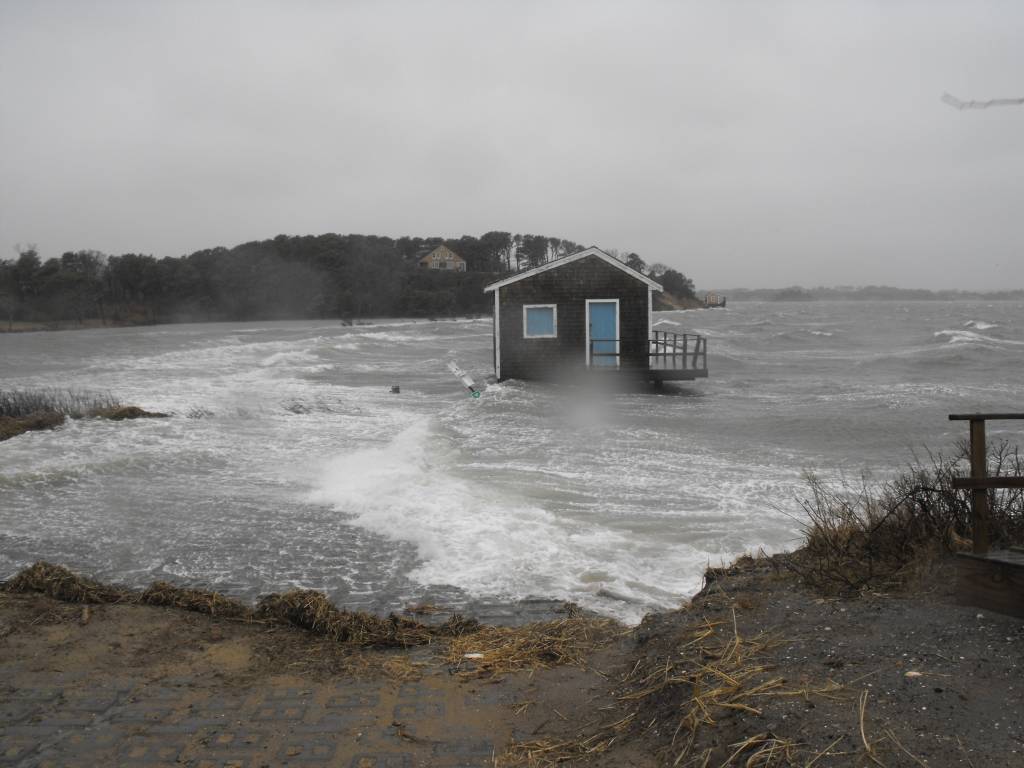
Researchers estimate that these extraordinary tides will become the new average high tides. To get a snapshot of the future, the King Tide Project, a partnership between the Washington State Department of Ecology and Washington Sea Grant, encourages citizens to get to the beach and photograph these extreme tides.
“To be clear, king tides are a natural occurrence,” said Bridget Trosin, coordinator of the King Tides Project. “It does help us visualize what sea-level rise will look like.”
Using data from these photographs, scientists have been able to create a map of Washington’s shorelines. To see what a nearby bay is predicted to look like, visit wacoastalnetwork.com/wcrp-documents.
There are lot of unknowns about sea level rise, White noted.
To begin, he explained that physicists state everything in the universe vibrates to certain frequencies. That is true of each ocean basin as well, depending on the basin’s texture. Gravel quivers differently than sand or granite. The salinity and temperature would also affect a location’s oscillation As sea level rises, each basin may have higher or lower tides depending on the vibration. According to White, the Bay of Fundy in Canada has high tidal ranges which oceanographers attribute to what they call tidal resonances. To illustrate how this works, White uses the metaphor of something everyone has done at one point in their lives, singing in the shower.
“The shower stall is the basin, and the singer represents the relationship of that basin to the heavens,” White explained, continuing to add that if that shower stall was perhaps a C note, but then the bottom was filled with water, the stall might then begin resonating as a D note.
To decipher how different areas of the ocean will react, White said, oceanographers have been trying to create a sophisticated model. However, a model of this detail requires a great deal of time, energy and funds.
In the meantime, photos of extreme tides and winter storm surges have aided researches in gathering specific local data. The King Tide Project has an app, mycoast.org/wa, that allows people to submit their photos right from their phones. The app, according to Trosin, even date stamps the photo and provides the location.
“Pictures say 1,000 words, and we are learning a lot from people’s photos,” Trosin said.
For more information on the project, visit https://wsg.washington.edu/community-outreach/hazard-resilience-and-climate-adaptation/king-tides/program.
